1 Overview
The Nielsen Digital SDK Integration Assistance & Diagnostic Tool (short: SDK Diagnostic Tool) helps developers integrate the Nielsen SDK correctly and validate their implementation before certification.
Integration Wizard
Step-by-step SDK integration guidance. Access documentation, code examples, and implementation assistance for DCR Static, DCR Video & DTVR integrations.
Diagnostic Tool
Diagnose and validate DCR Static, DCR Video & DTVR integrations. Capture logs from mobile apps and browsers, run validation tests, and diagnose SDK implementation.
Which Variant Do I Need?
| Variant | Includes | Market Dropdown Options | Use When |
|---|---|---|---|
| Global | DCR Video, DCR Static, DTVR | Global, Médiamétrie | Your integration targets the Global market and/or includes DTVR. |
| Cookieless (AGF) | DCR Video, DCR Static | AGF, Médiamétrie | Your integration targets a cookieless deployment (e.g., the German or French market). |
Key Resources
2 Installation
Download the correct variant (Global or Cookieless) for your platform from the GitHub Releases page.
🍎 macOS (DMG)
▼Download
Download NielsenTool.dmg (Global) or NielsenTool-Cookieless.dmg (Cookieless) from GitHub Releases.
Open & Install
Open the DMG file. Drag NielsenTool.app to the Applications folder shortcut shown in the window.
First Launch
Double-click NielsenTool.app in Applications. macOS may ask "Are you sure you want to open it?" — click Open. You may also see additional permission prompts (Accessibility, Terminal access, etc.) — click Allow for each. These are required for device log capture.
Grant Permissions
The app may ask to control Terminal.app — click Allow. For certain devices like Apple TV, the tool may prompt for your macOS password (sudo access) to establish the wireless connection.
Ready
Terminal opens, checks for updates, and launches the tool. Your default browser opens automatically at localhost:3000.
💻 Windows (ZIP)
▼Download
Download nls-validator-win.zip (Global) or nls-validator-win-agf.zip (Cookieless) from GitHub Releases.
Extract
Extract the ZIP to any folder.
Launch
Double-click nls-validator.bat. The tool starts and your browser opens automatically at localhost:3000.
http://localhost:3000/ into any browser to access the tool.Auto-Update
The tool automatically checks for updates every time you launch it. If a newer version is available, it downloads and installs before starting — no action needed on your part. If auto-update fails (e.g., behind a corporate proxy), download the latest version manually from GitHub Releases.
3 Quick Start
Launch the tool
Open NielsenTool (macOS) or run nls-validator.bat (Windows). The UI opens at localhost:3000.
Choose a Module
Select Integration Wizard (code generation) or Diagnostic Tool (validate your implementation).
Follow the guided flow
Both modules provide step-by-step guidance. The Diagnostic Tool also includes a built-in interactive tutorial — click the route icon to start it.
4 Integration Wizard
A 7-step guided wizard that generates platform-specific code snippets for your Nielsen SDK integration. It helps you write the correct integration code before you test it.
Step 1 Configuration Platform & SDK Variant
▼Select your application platform, programming language, and package manager. This choice determines all code snippets in later steps.
| Platform | Languages | Package Managers |
|---|---|---|
| iOS | Swift, Objective-C | CocoaPods, Carthage, Swift Package Manager |
| Android | Java, Kotlin | Gradle (with SDK flavor: Ad ID, Vendor ID, No ID) |
| Web/Browser | JavaScript | NPM / CDN Static Queue |
| tvOS | Swift, Objective-C | CocoaPods, Carthage, Swift Package Manager |
| Domless | JavaScript | NPM (React Native, Amazon Fire TV, Node.js, Custom) |
Step 2 App ID Nielsen Configuration
▼Enter your Nielsen App ID — a unique identifier in P-UUID format provided by your Nielsen TAM. The wizard validates the format and (for Web) auto-detects your CDN domain (cookieless vs standard). Optional advanced parameters can be added here.
Step 3 Import & Init Setup SDK
▼The wizard generates SDK import statements, dependency installation instructions, and initialization code for your platform. Includes CDN domain configuration. All code blocks are copy-paste ready with inline comments.
Step 4 Select Product Content Type
▼Choose your measurement product:
- Video (DCR Video) — For video content measurement
- Static Content/Pages (DCR Static) — For page view measurement
- Digital TV (DTVR) — For TV audience measurement (Global variant only)
You can integrate multiple products — the wizard tracks which ones you've completed.
Step 5 Implementation API Integration
▼Complete API integration code tailored to your selected product. Includes metadata objects, event handling, playhead tracking, and all required SDK API calls. For DCR Video, you can toggle between content-only and content + ads flows. Each code block includes inline comments explaining the purpose.
Step 6 Advanced APIs Optional Features
▼Optional advanced features you can add to your integration:
- Update OTT Status — OTT device reporting
- Track Viewability — Ad viewability measurement
- Pagination Events — Paginated content tracking
- Update Metadata — Mid-stream metadata updates
- Volume Reporting — Audio volume level tracking
- Privacy and Opt-Out — User privacy controls (with flavor-specific implementation)
- Disable SDK — Runtime SDK enable/disable
Skip any that don't apply to your use case.
Step 7 Completion Summary & Next Steps
▼Summary of your configuration — shows your App ID, platform(s), and all integrated products with checkmarks. From here you can add more products, integrate for another platform, or return to the home screen to start validation testing.
5 Validation Interface
The Diagnostic Tool's validation screen is divided into three main areas. Here's a breakdown of each:
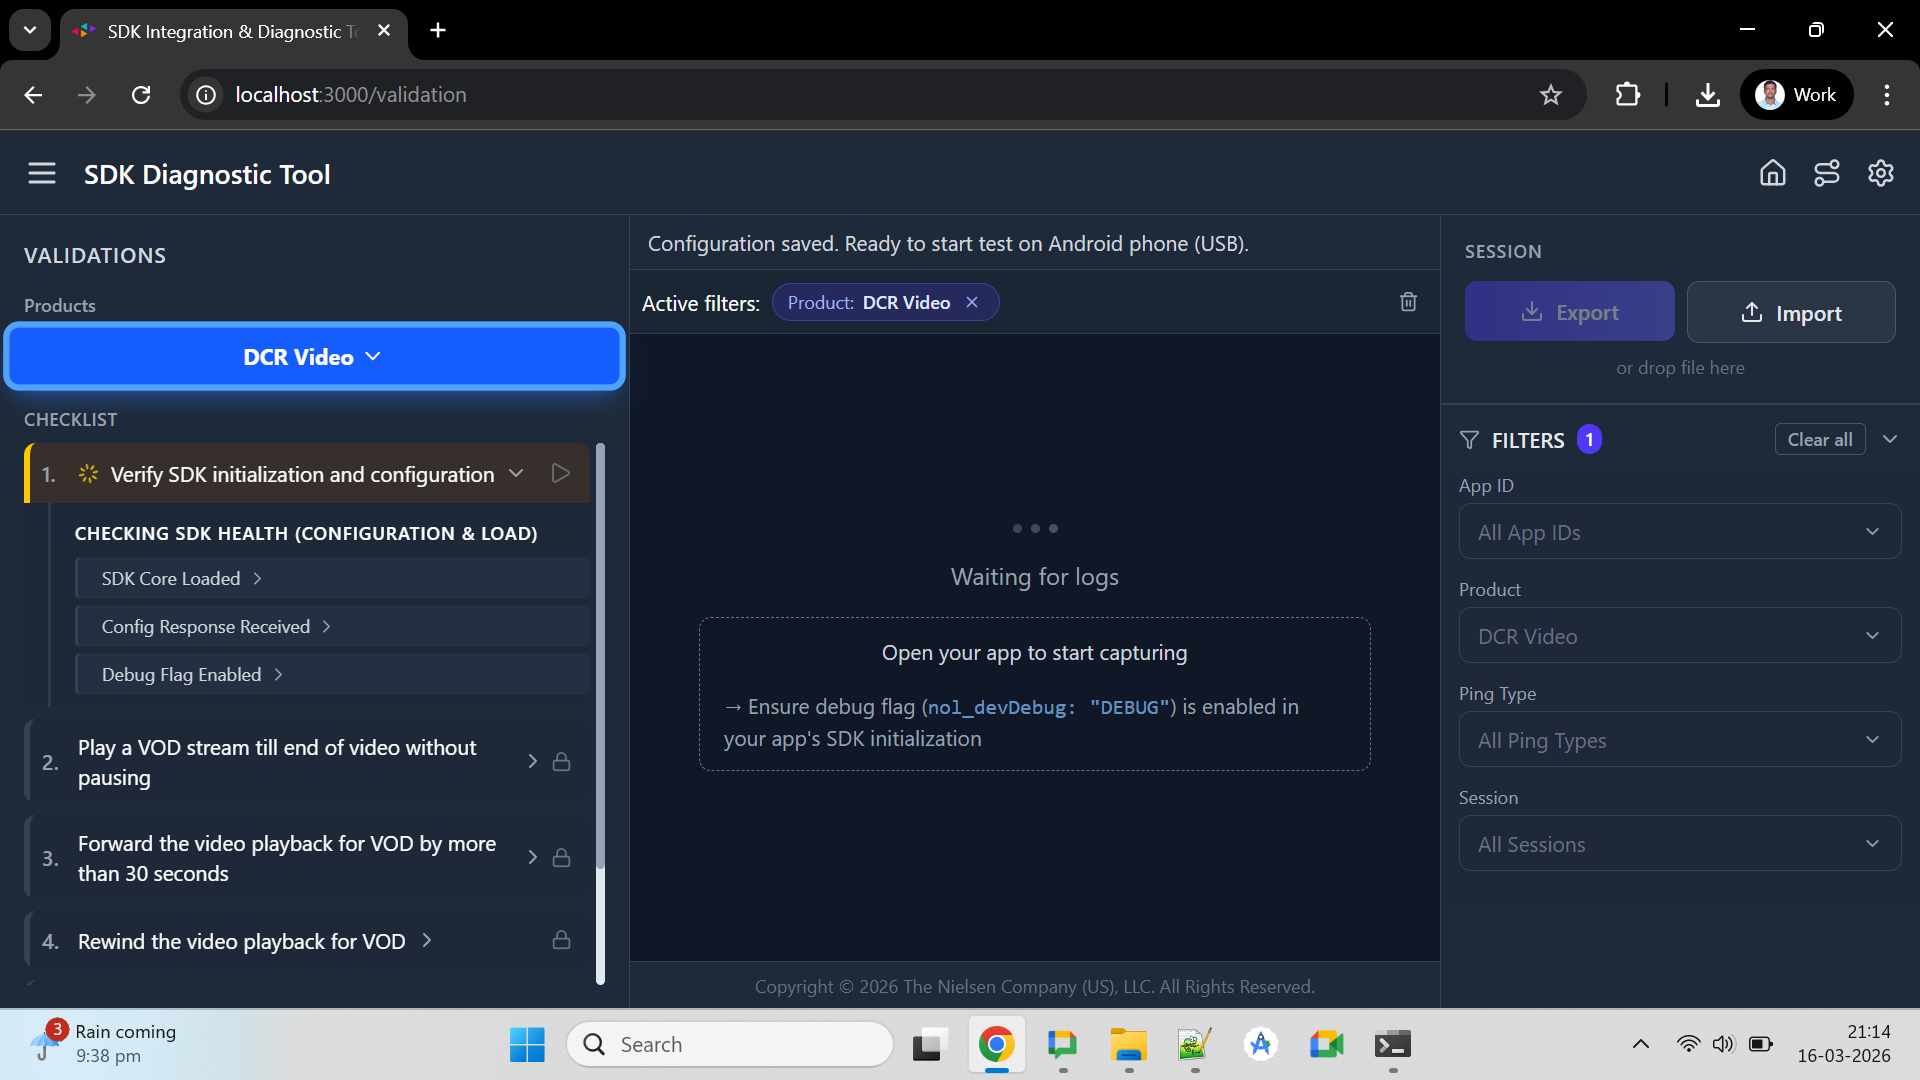
Header Bar
The top header bar displays the tool name, Cookieless badge (shown for AGF/Médiamétrie markets), and action icons. From left to right: the hamburger menu (☰) toggles the validation panel, then on the right side: Home (go back to module selection), Tutorial (route icon — restart the guided walkthrough), and Configuration (gear icon — open device/product settings).

The header shows the tool name, variant badge (shown if Cookieless variant), and action icons: Hamburger menu (toggle panel), Home, Tutorial (route icon), Configuration (gear).
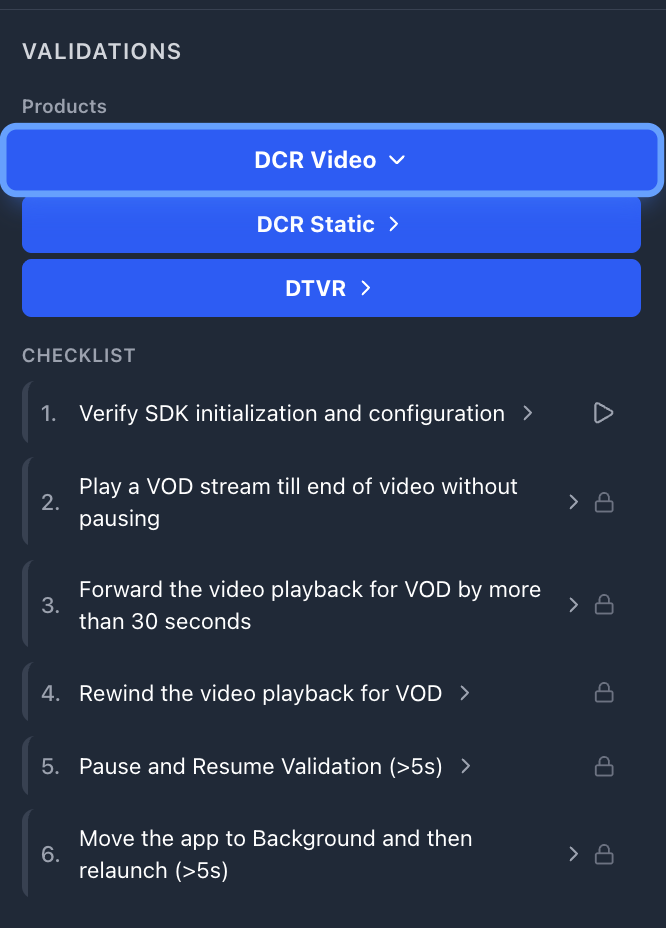
📋 Left Panel — Validation Checklist
This is your test control center. It shows:
- Product buttons at the top (e.g., "DCR Static", "DCR Video") — click to expand/collapse that product's test cases
- Numbered test cases (e.g., "1. Play a VOD stream till end of video without pausing")
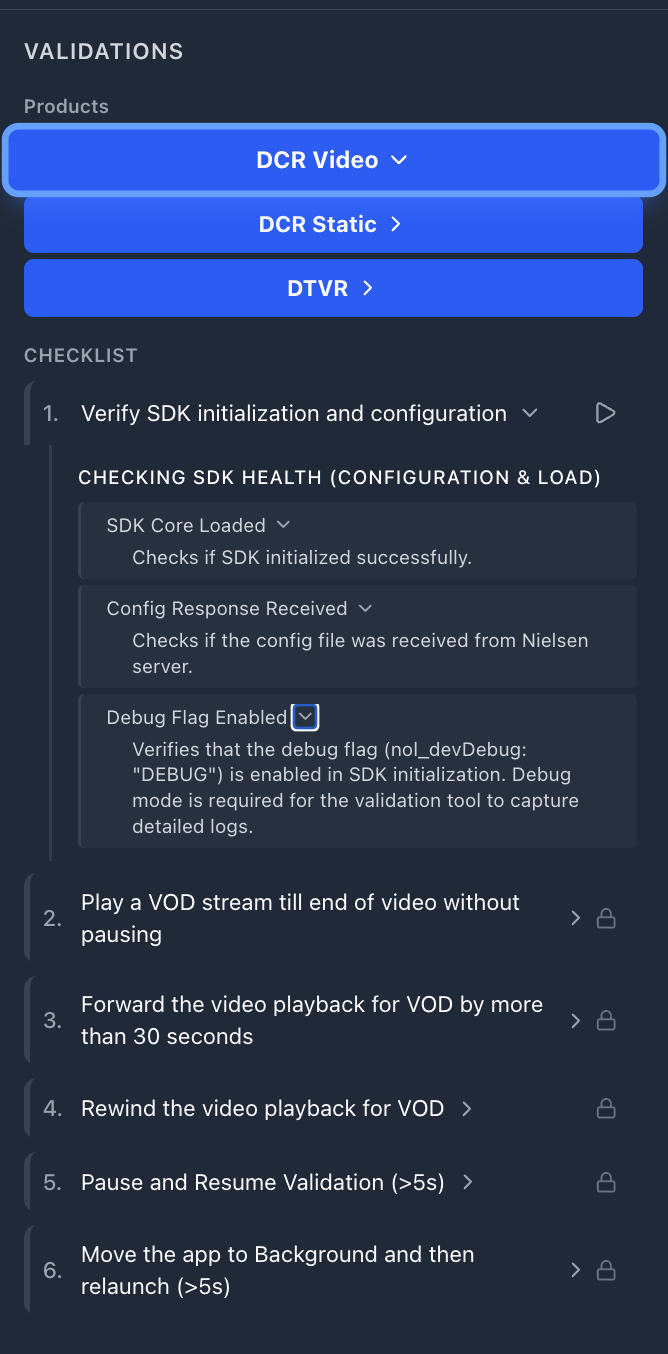
- Each test case expands into grouped sub-rules organized by category
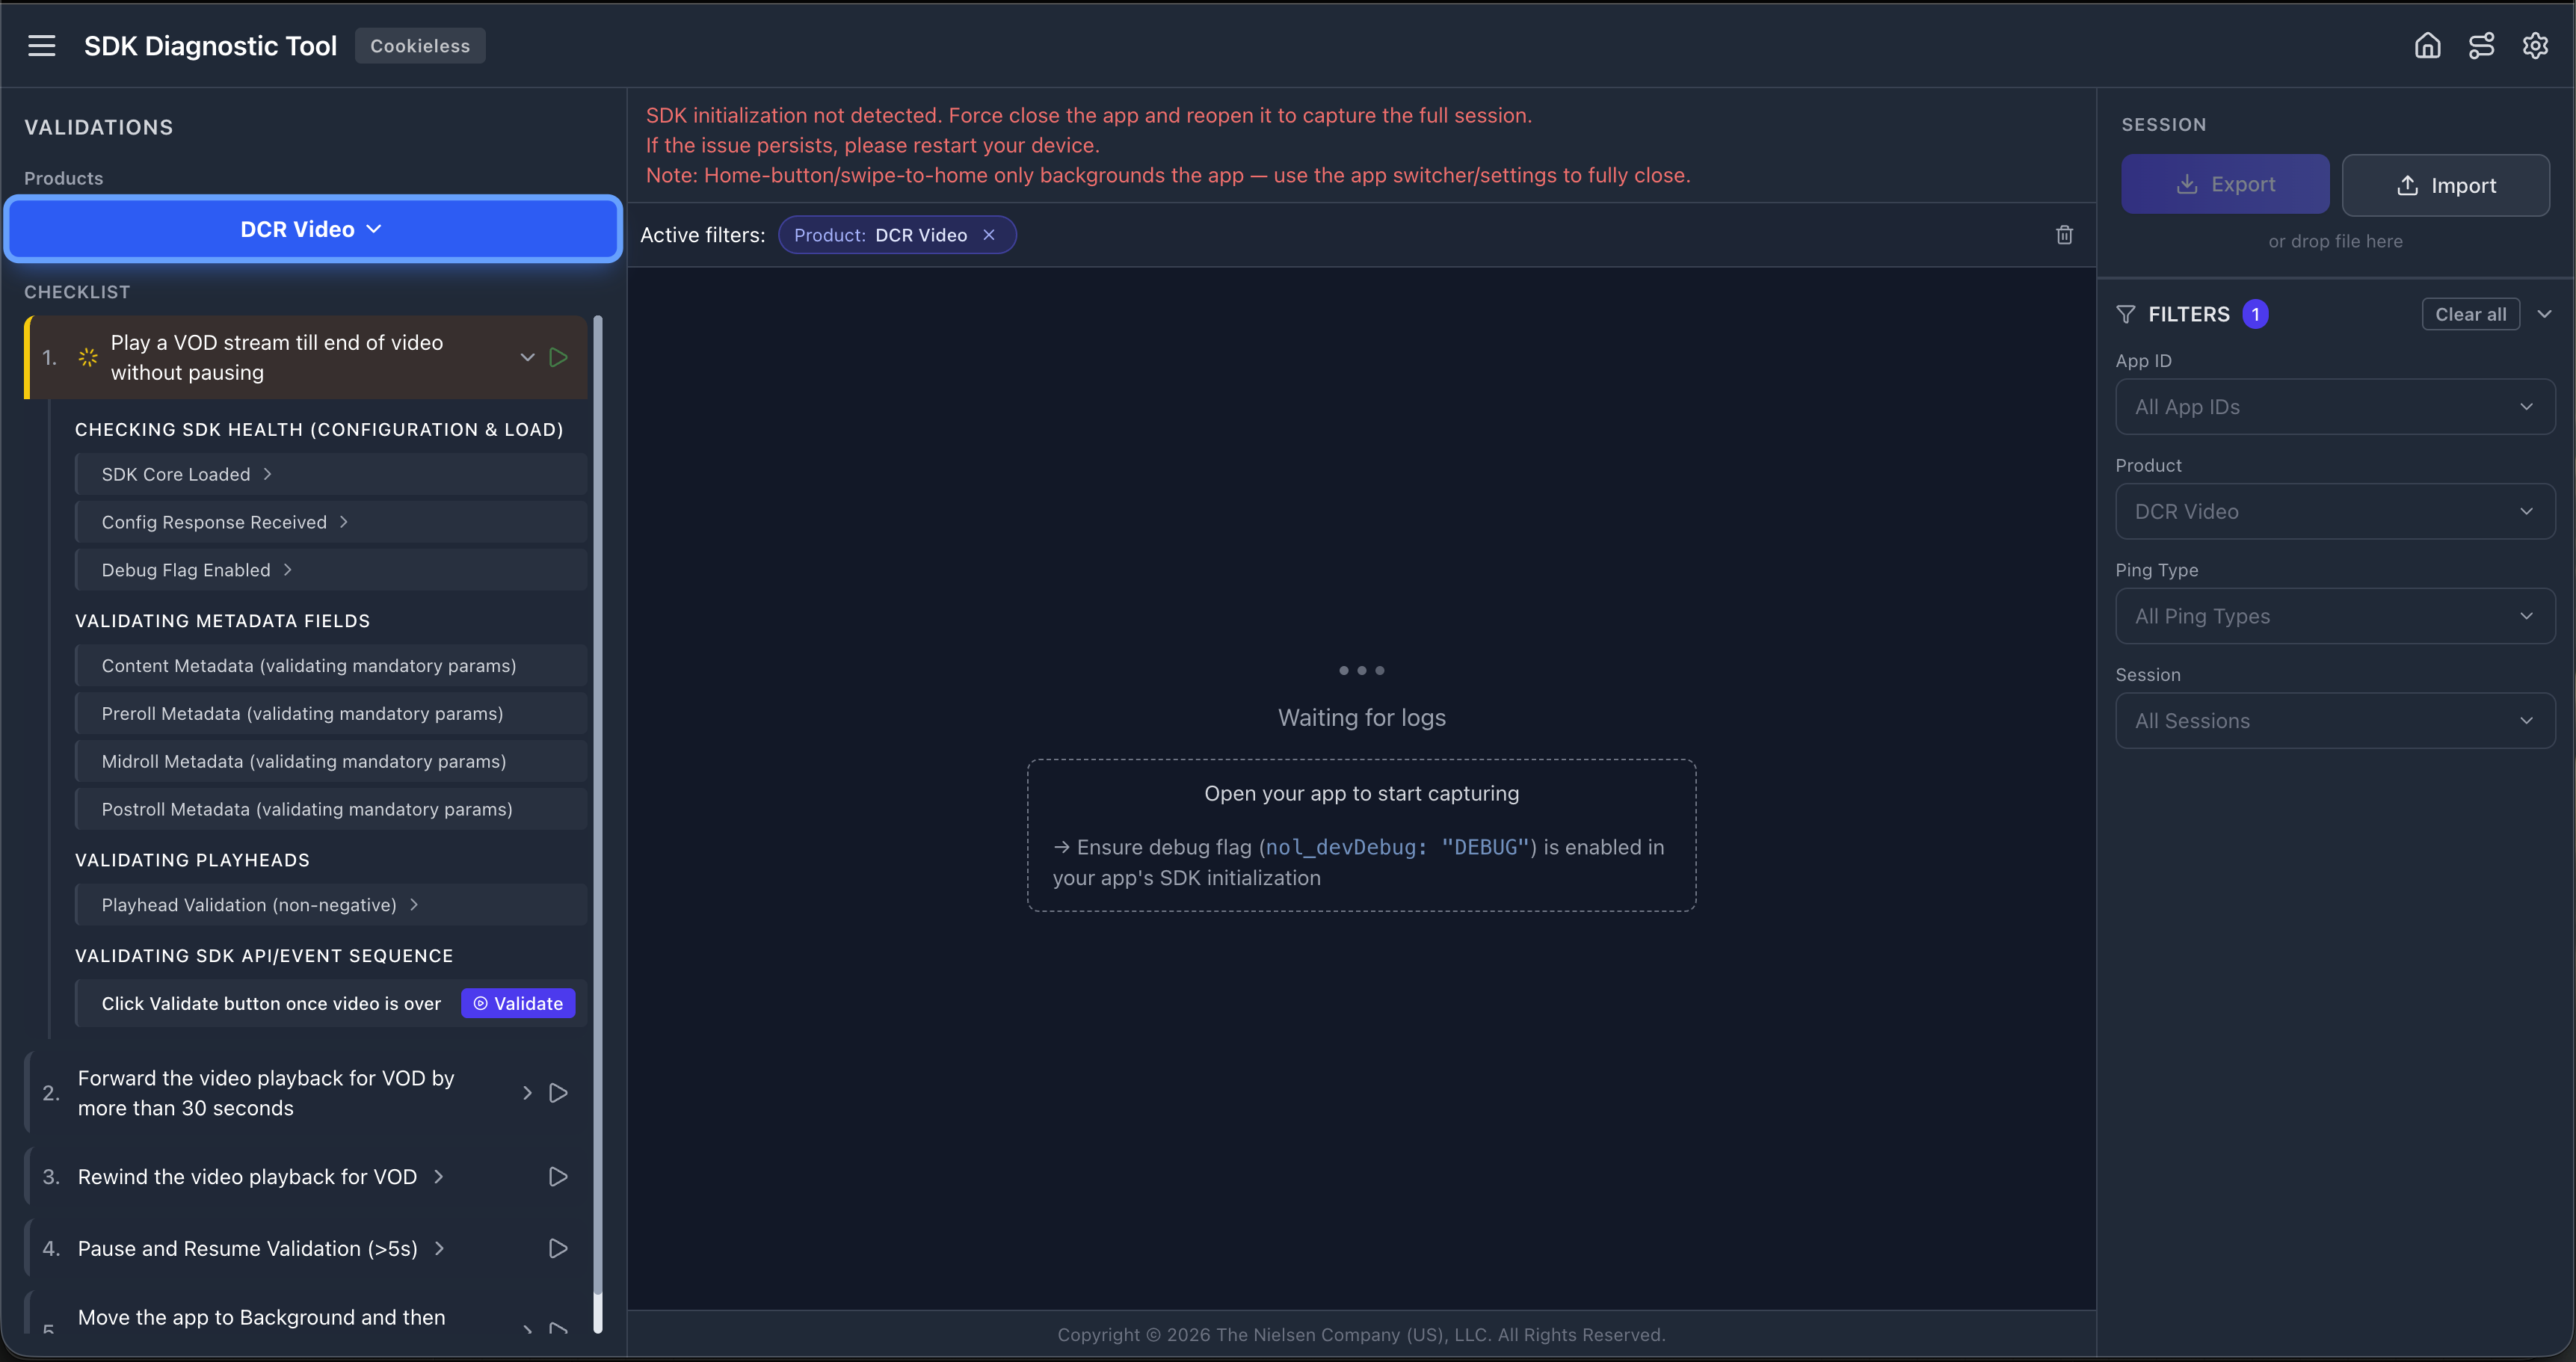
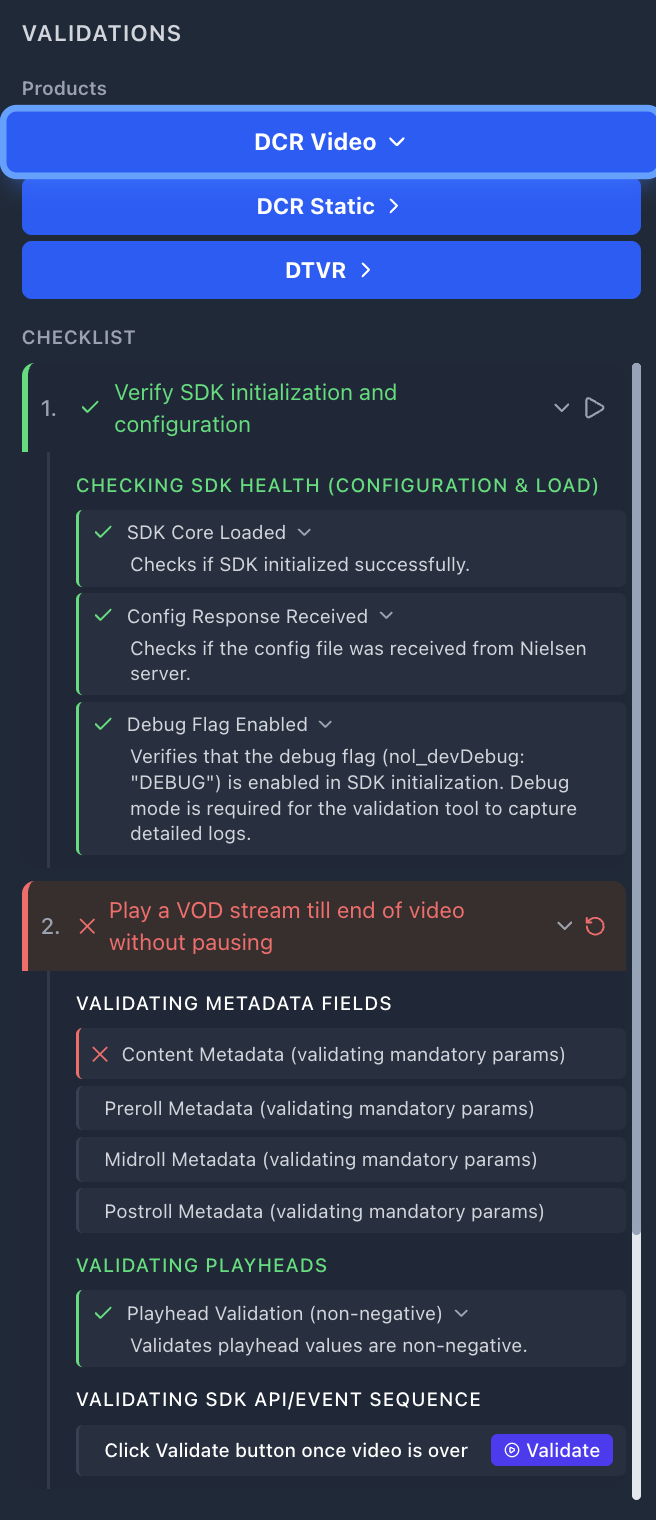
DCR Video checklist (example showing Test Case 1 expanded, others locked):
🔒 = Locked (run Test Case 1 first to unlock). 🔓 = Unlocked once SDK health check completes.
Each rule has a › expand arrow — click it to see the rule's FAQ with detailed guidance on what the rule checks and how to fix failures.
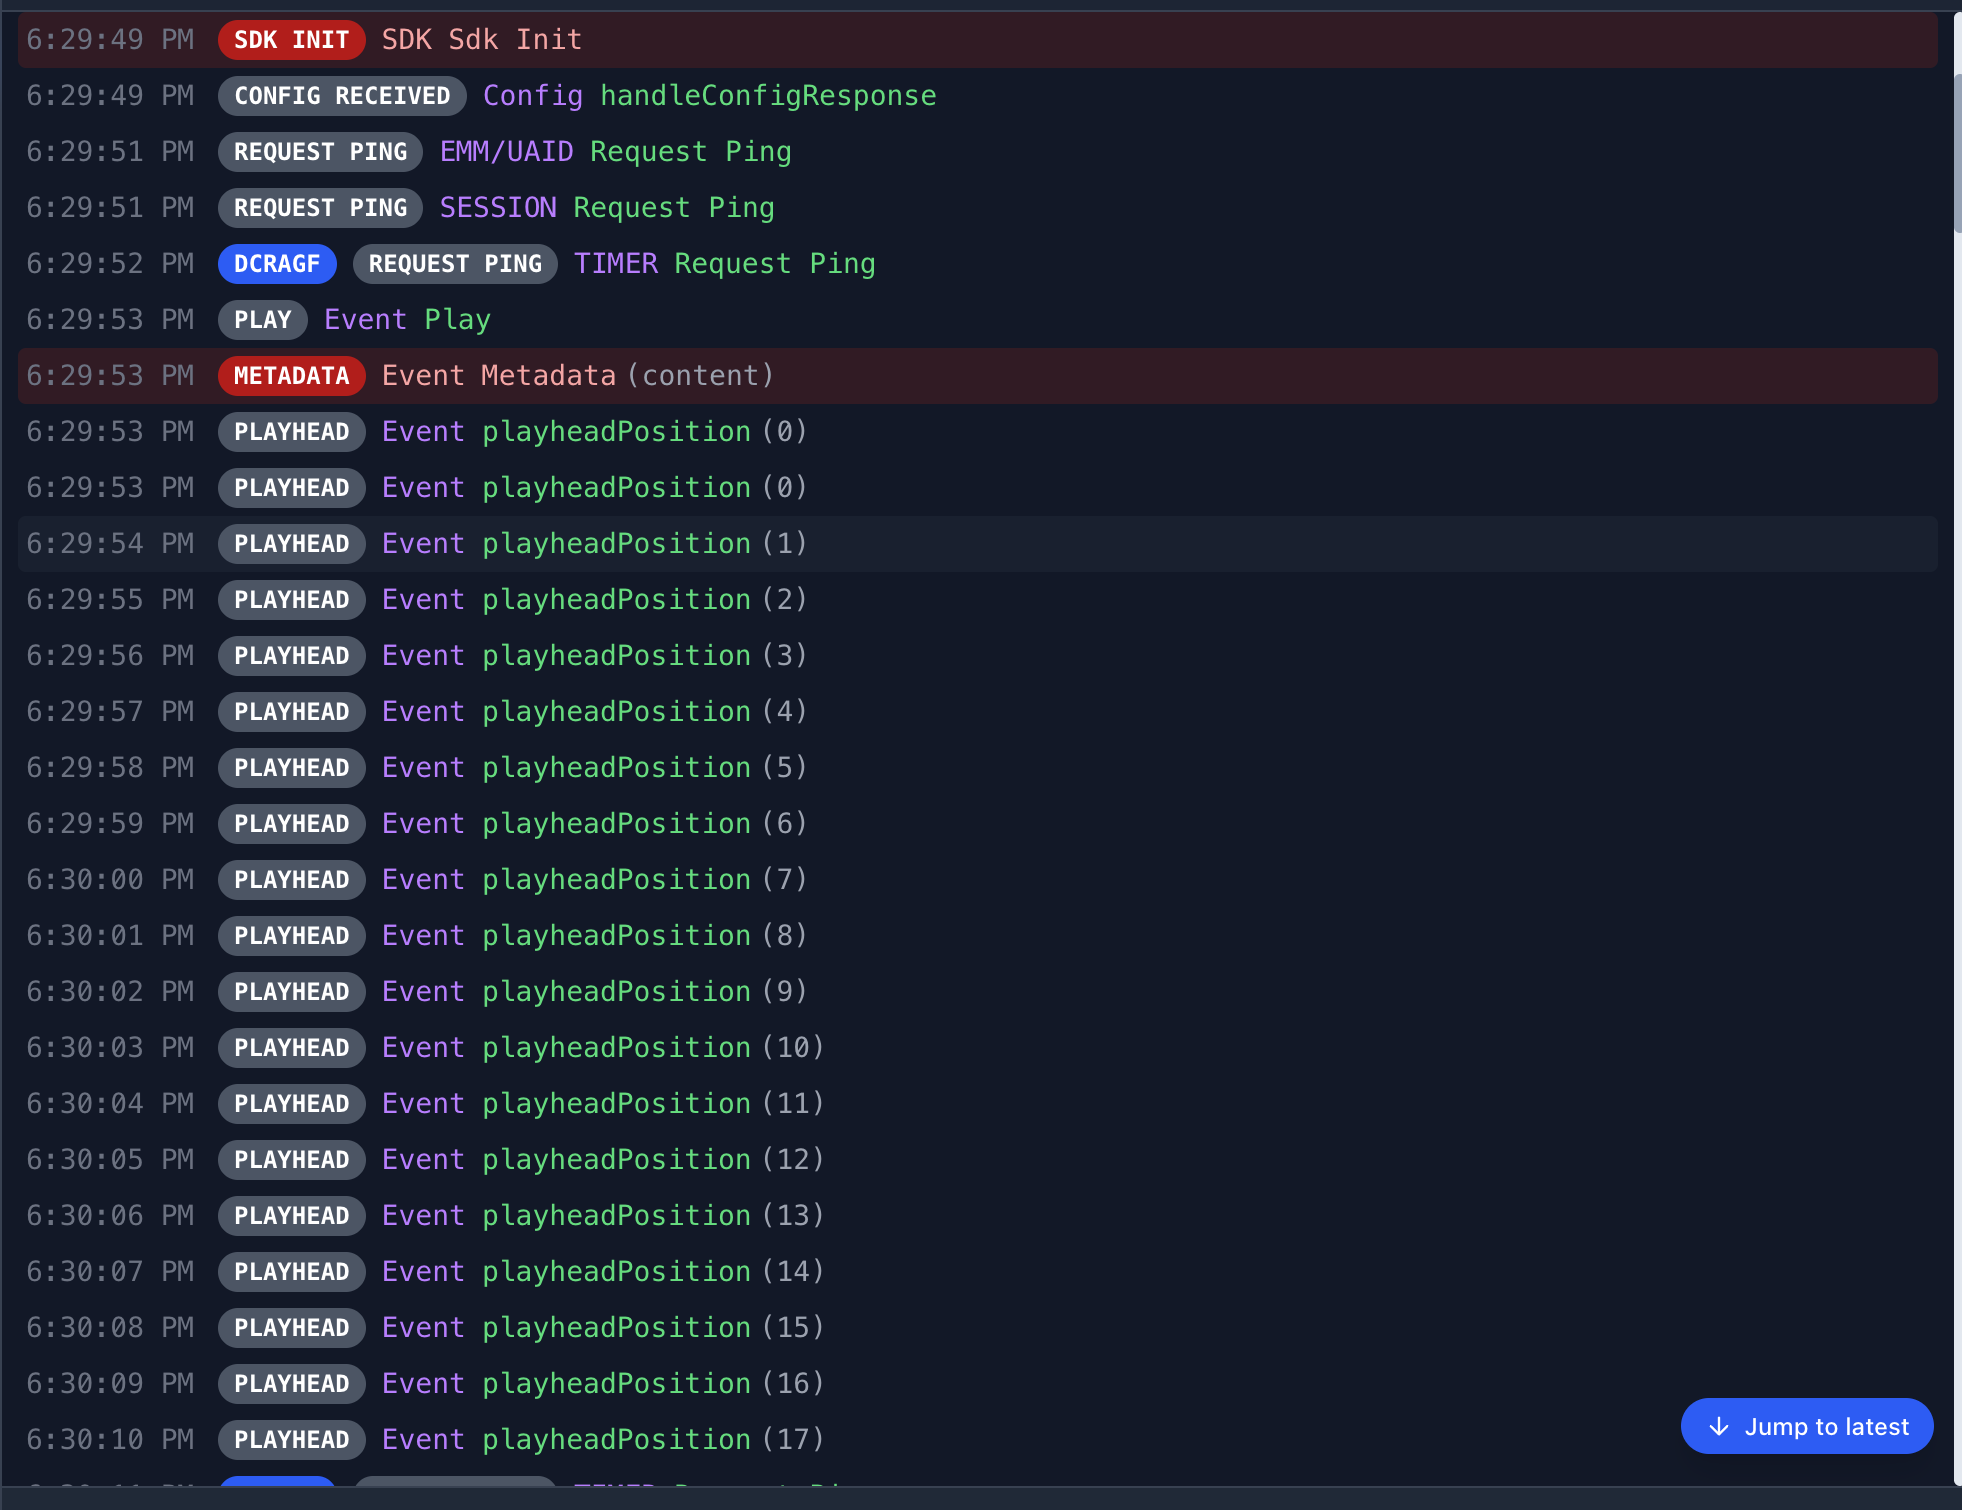
📊 Center Panel — Live Log Stream
Every SDK event appears here in real time as it's captured from your device. Each log entry shows:
- Timestamp (e.g., 3:04:31 PM)
- Color-coded badges with three color states: REQUEST PING Blue — ping/request events, SDK INIT CONFIG RECEIVED PLAY METADATA PLAYHEAD Grey — normal SDK events, ERROR Red — only when validation fails for that log entry
- Event description (e.g., "EMM/UAID Request Ping", "Event playheadPosition (5)")
Real-time Error Highlighting
The log stream actively highlights problems:
- Red background rows — Validation errors detected (e.g., metadata fields don't match CMS mapping, debug flag missing). A red banner shows "VALIDATION FAILED (N ISSUES)" with a description of what's wrong.
- Yellow background rows — Warnings that may need attention but aren't blocking failures.
- Normal rows — Events that passed validation or don't have validation rules.
The test case label bar above the log stream shows which test is active (e.g., "Test 1: Play a VOD stream till end of video without pausing") and includes a "Jump to latest" button to scroll to the most recent log.
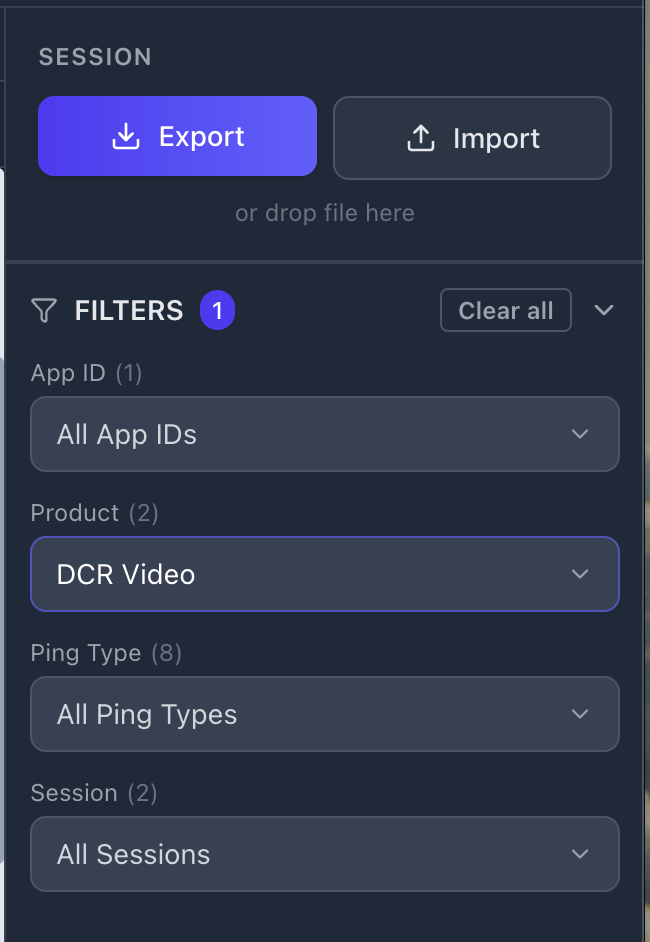
📄 Right Panel — Session & Filters
Session Controls
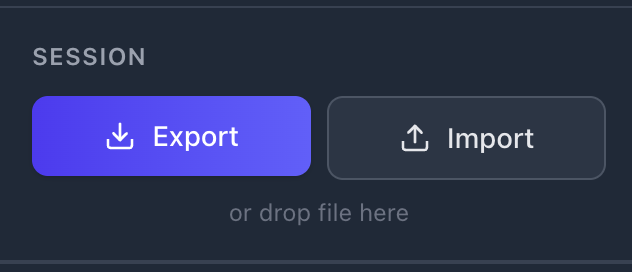
- Export (purple button) — Downloads the current session as a
.jsonfile with all validation results, captured logs, and a SHA-256 integrity hash. Enabled once logs exist and an App ID is detected. - Import — Load a previously exported
.jsonsession. Click the button or drag-and-drop the file directly onto "or drop file here" area. Imported sessions are verified for integrity.
Filters
Below the session controls, a collapsible FILTERS section lets you narrow down the log stream. An active filter count badge appears when filters are applied. Available filters:
| Filter | Purpose |
|---|---|
| App ID | Filter by specific Nielsen App ID (useful if multiple SDK instances detected) |
| Product | Filter by product type (DCR Video, DCR Static, DTVR) |
| Ping Type | Filter by ping type (e.g., VIEW, TIMER, SESSION, EMM/UAID) |
| Session | Filter by SDK session ID (useful for multi-session validation) |
Use "Clear all" to remove all active filters at once. Each filter dropdown shows the count of available options.
Configuration Modal
Click the gear icon (⚙) in the header to open Configuration. It shows:
| Setting | When | Purpose |
|---|---|---|
| Device | Always | Select your connected device, simulator, emulator, or browser from the dropdown |
| Products | Always | Check the product types to validate (e.g., DCR Video, DCR Static). DTVR only in Global variant. |
| Web Address | Browser selected | Full URL of the page with SDK integrated (include https://) |
| IP Address | Fire TV selected | Device IP address (e.g., 192.168.1.100) |
| Refresh Devices | Always | Re-scan for connected devices if yours doesn't appear |
| Continue | Always | Saves configuration and returns to the validation view |
Full Interface Overview
Here's how all three panels work together during a live validation session:
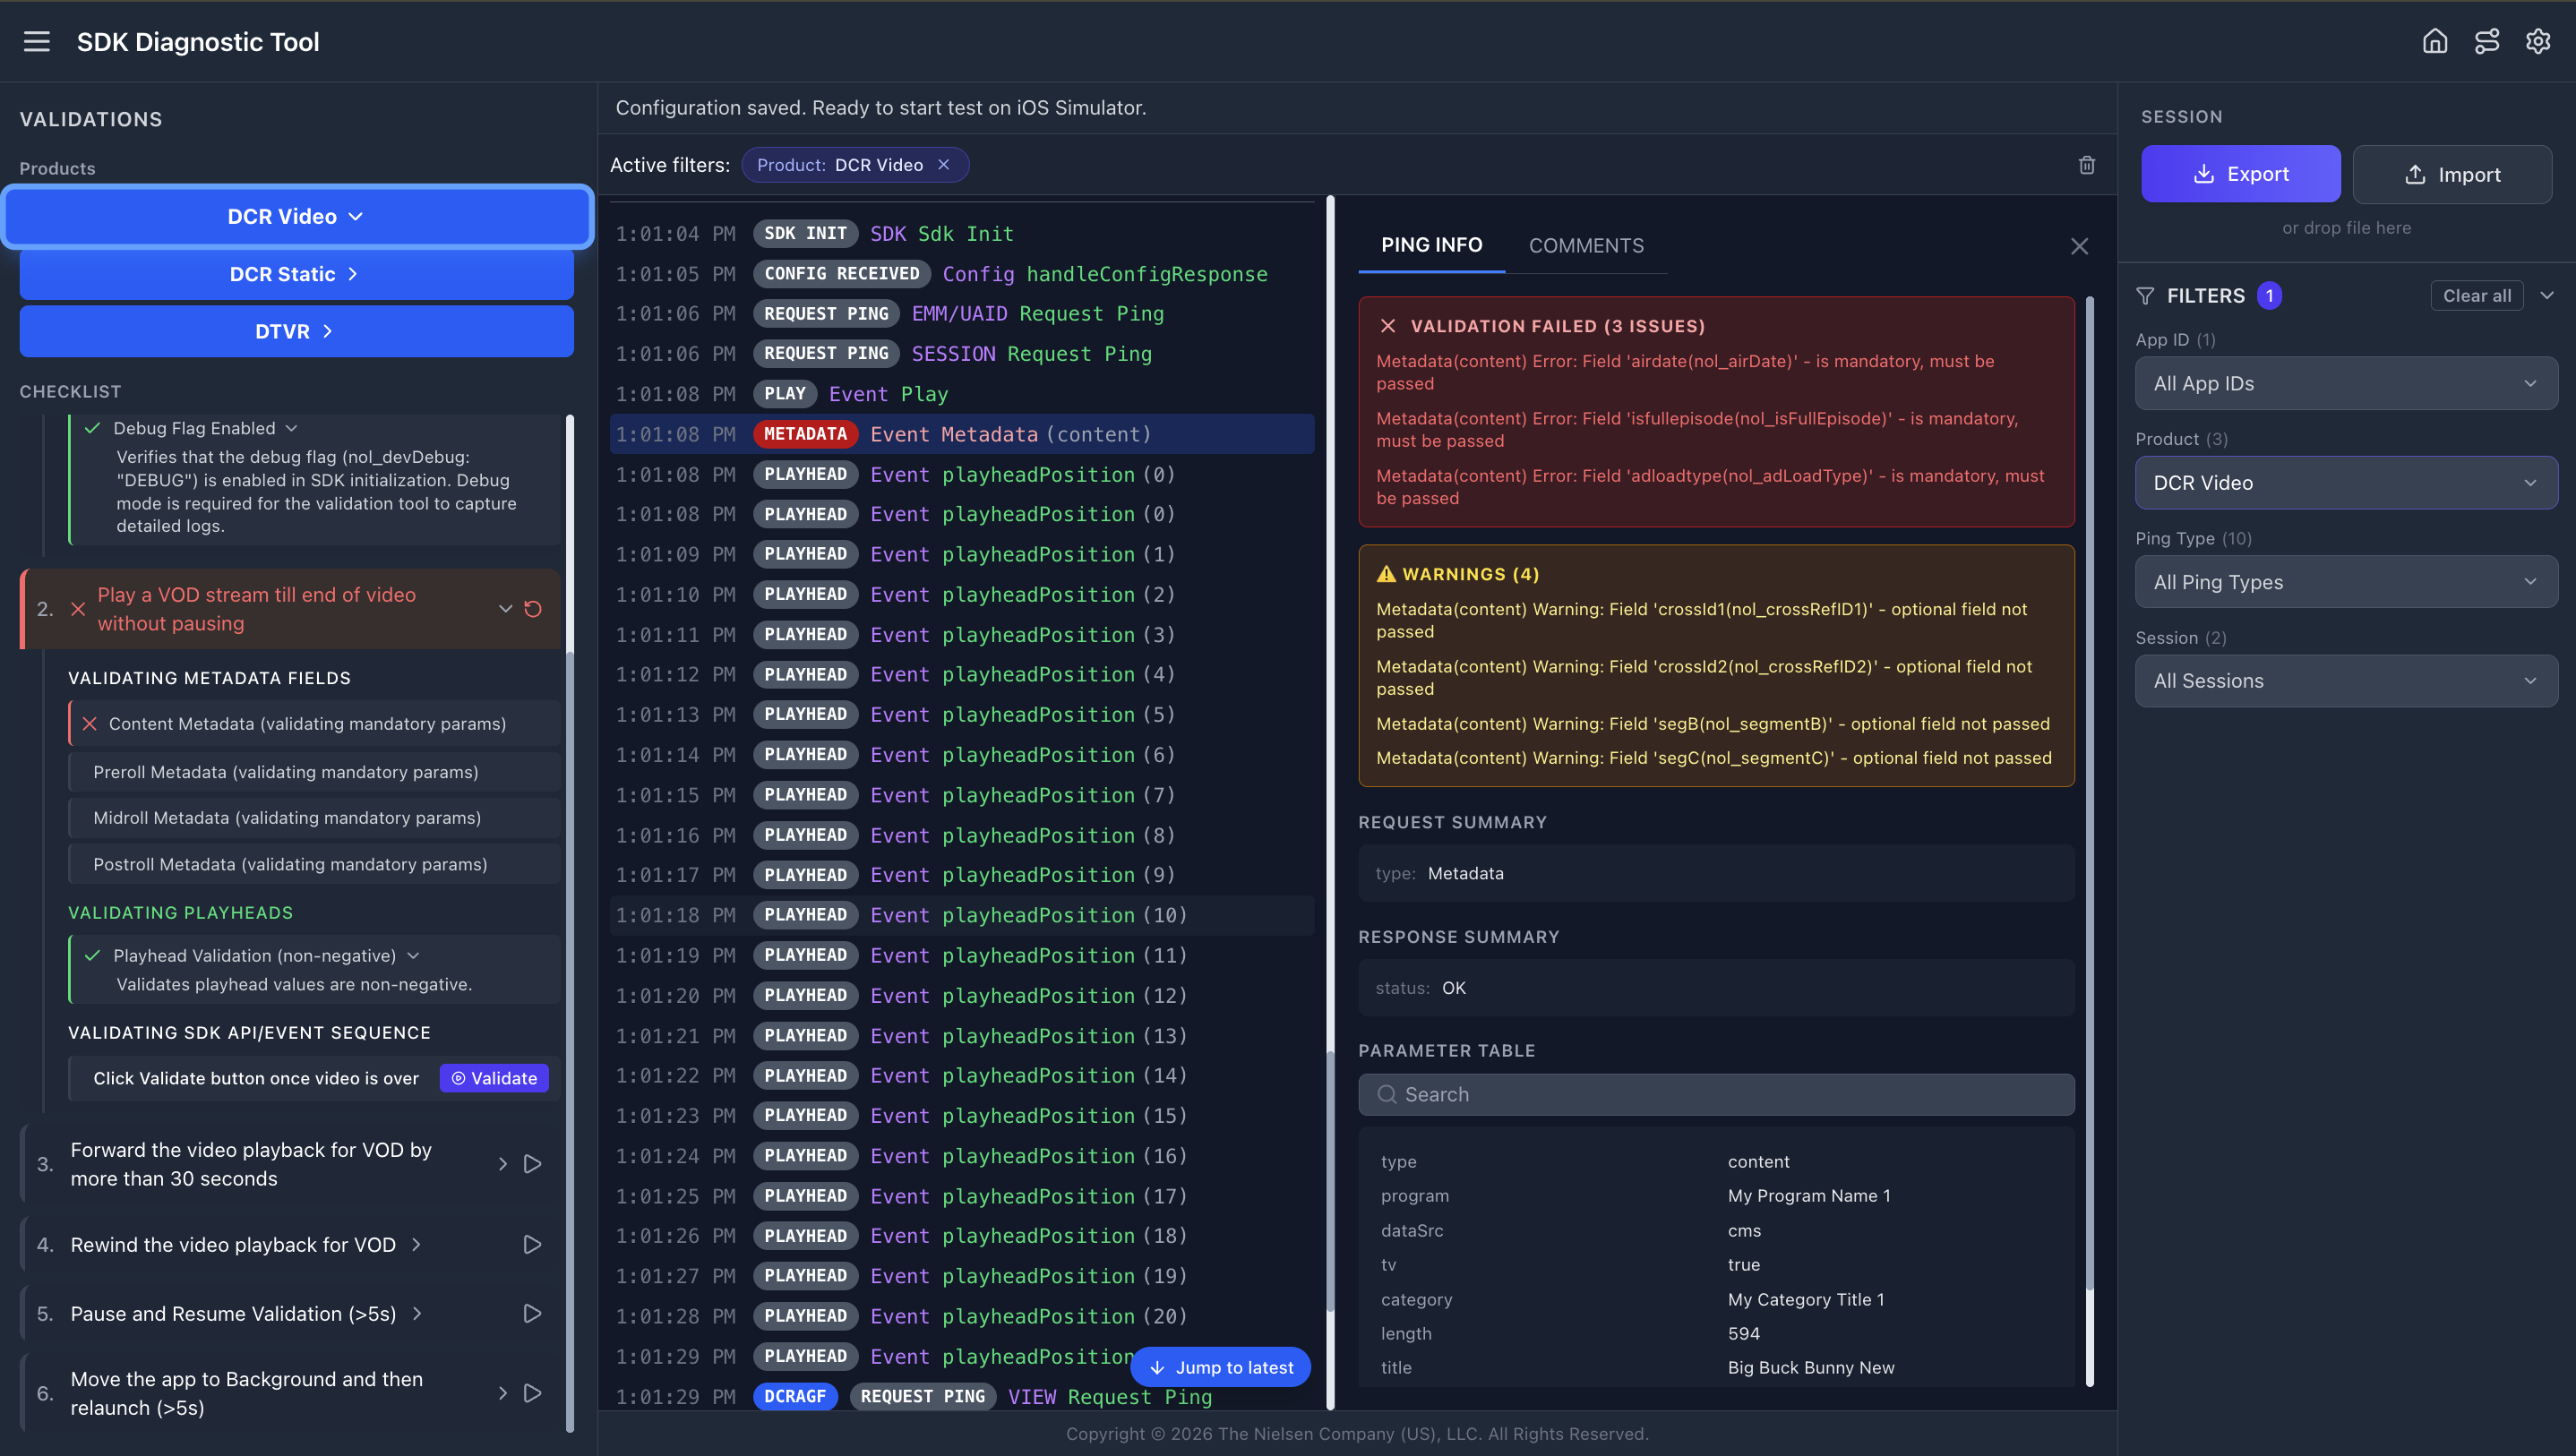
The three-panel layout: Left — validation checklist with expandable rules. Center — live log stream with color-coded badges. Right — session export/import and log filters.
6 Running Your First Validation
Workflow
Platform & Device Walkthroughs
Before You Begin
✅ Device connected and unlocked (USB) or on same Wi-Fi network
✅ App installed but NOT launched yet (mobile only — browser opens automatically)
✅ Debug flag set (mobile only — browser is automatic, see below)
🔐 Debug Flag Setup
▼The debug flag enables detailed log output the tool needs for full validation. Without it, the SDK still produces some logs, but the "Debug Flag Enabled" rule will fail.
App SDK (iOS, Android, tvOS, Fire TV) — set in your SDK initialization options:
nol_devDebug = DEBUG
Browser SDK (BSDK) — no manual setup needed. The tool automatically appends the debug parameter when you enter the URL.
nol_devDebug before your production release.
Step-by-Step
Open the tool, select Diagnostic Tool
Click the Diagnostic Tool card on the home screen.
Configure your device
Click the gear icon to open Configuration. Select your device from the dropdown. For browsers, enter the full URL. For Fire TV (Wi-Fi), enter the IP address. For Apple TV, follow the pairing flow (see Section 11).
Select your product types
Check the product types you want to validate (DCR Video, DCR Static, DTVR) and click Continue. Product buttons appear in the header bar.
Click Play on Test Case 1 ("Verify SDK initialization and configuration")
This is mandatory first — all other test cases are locked until this one completes. It activates log capture and evaluates SDK health rules. For mobile apps: do this BEFORE launching your app. For browsers: clicking Play automatically opens the URL — no manual launch needed. Once Test Case 1 passes or fails, the remaining tests unlock automatically (🔒 → 🔓).
Launch your app (mobile only)
Open the app on your device. For browser devices, skip this step — the URL was already opened automatically in step 4. Log entries begin appearing once the SDK initializes. You should see SDK INIT and CONFIG RECEIVED events first.
Perform the test case actions
Follow the instructions shown in the test case label (e.g., "Play a VOD stream till end of video without pausing"). Watch rules turn green as events pass validation. For DCR Video Test Case 2, click the purple Validate button after playback completes to check the full event sequence.
Complete remaining test cases
Click Play on the next test case (now unlocked) and follow its instructions. Repeat for all test cases in the product.
Export results
Click Export in the Session panel to download a .json file. Share with your Nielsen contact.
7 Interpreting Results
Gray — Not Evaluated
Rule hasn't been checked yet. Play isn't active or relevant events haven't fired.
Green — Passed
Log data matched expectations. This rule is satisfied.
Red — Failed
Data didn't match. Expand the rule to read the FAQ with fix guidance.
Every Rule Has Help Text
Click the › expand arrow next to any rule (pass or fail) to see its FAQ panel. This shows exactly what the rule checks, what went wrong, and how to fix it. For metadata failures, it identifies the specific field that didn't match the CMS mapping.
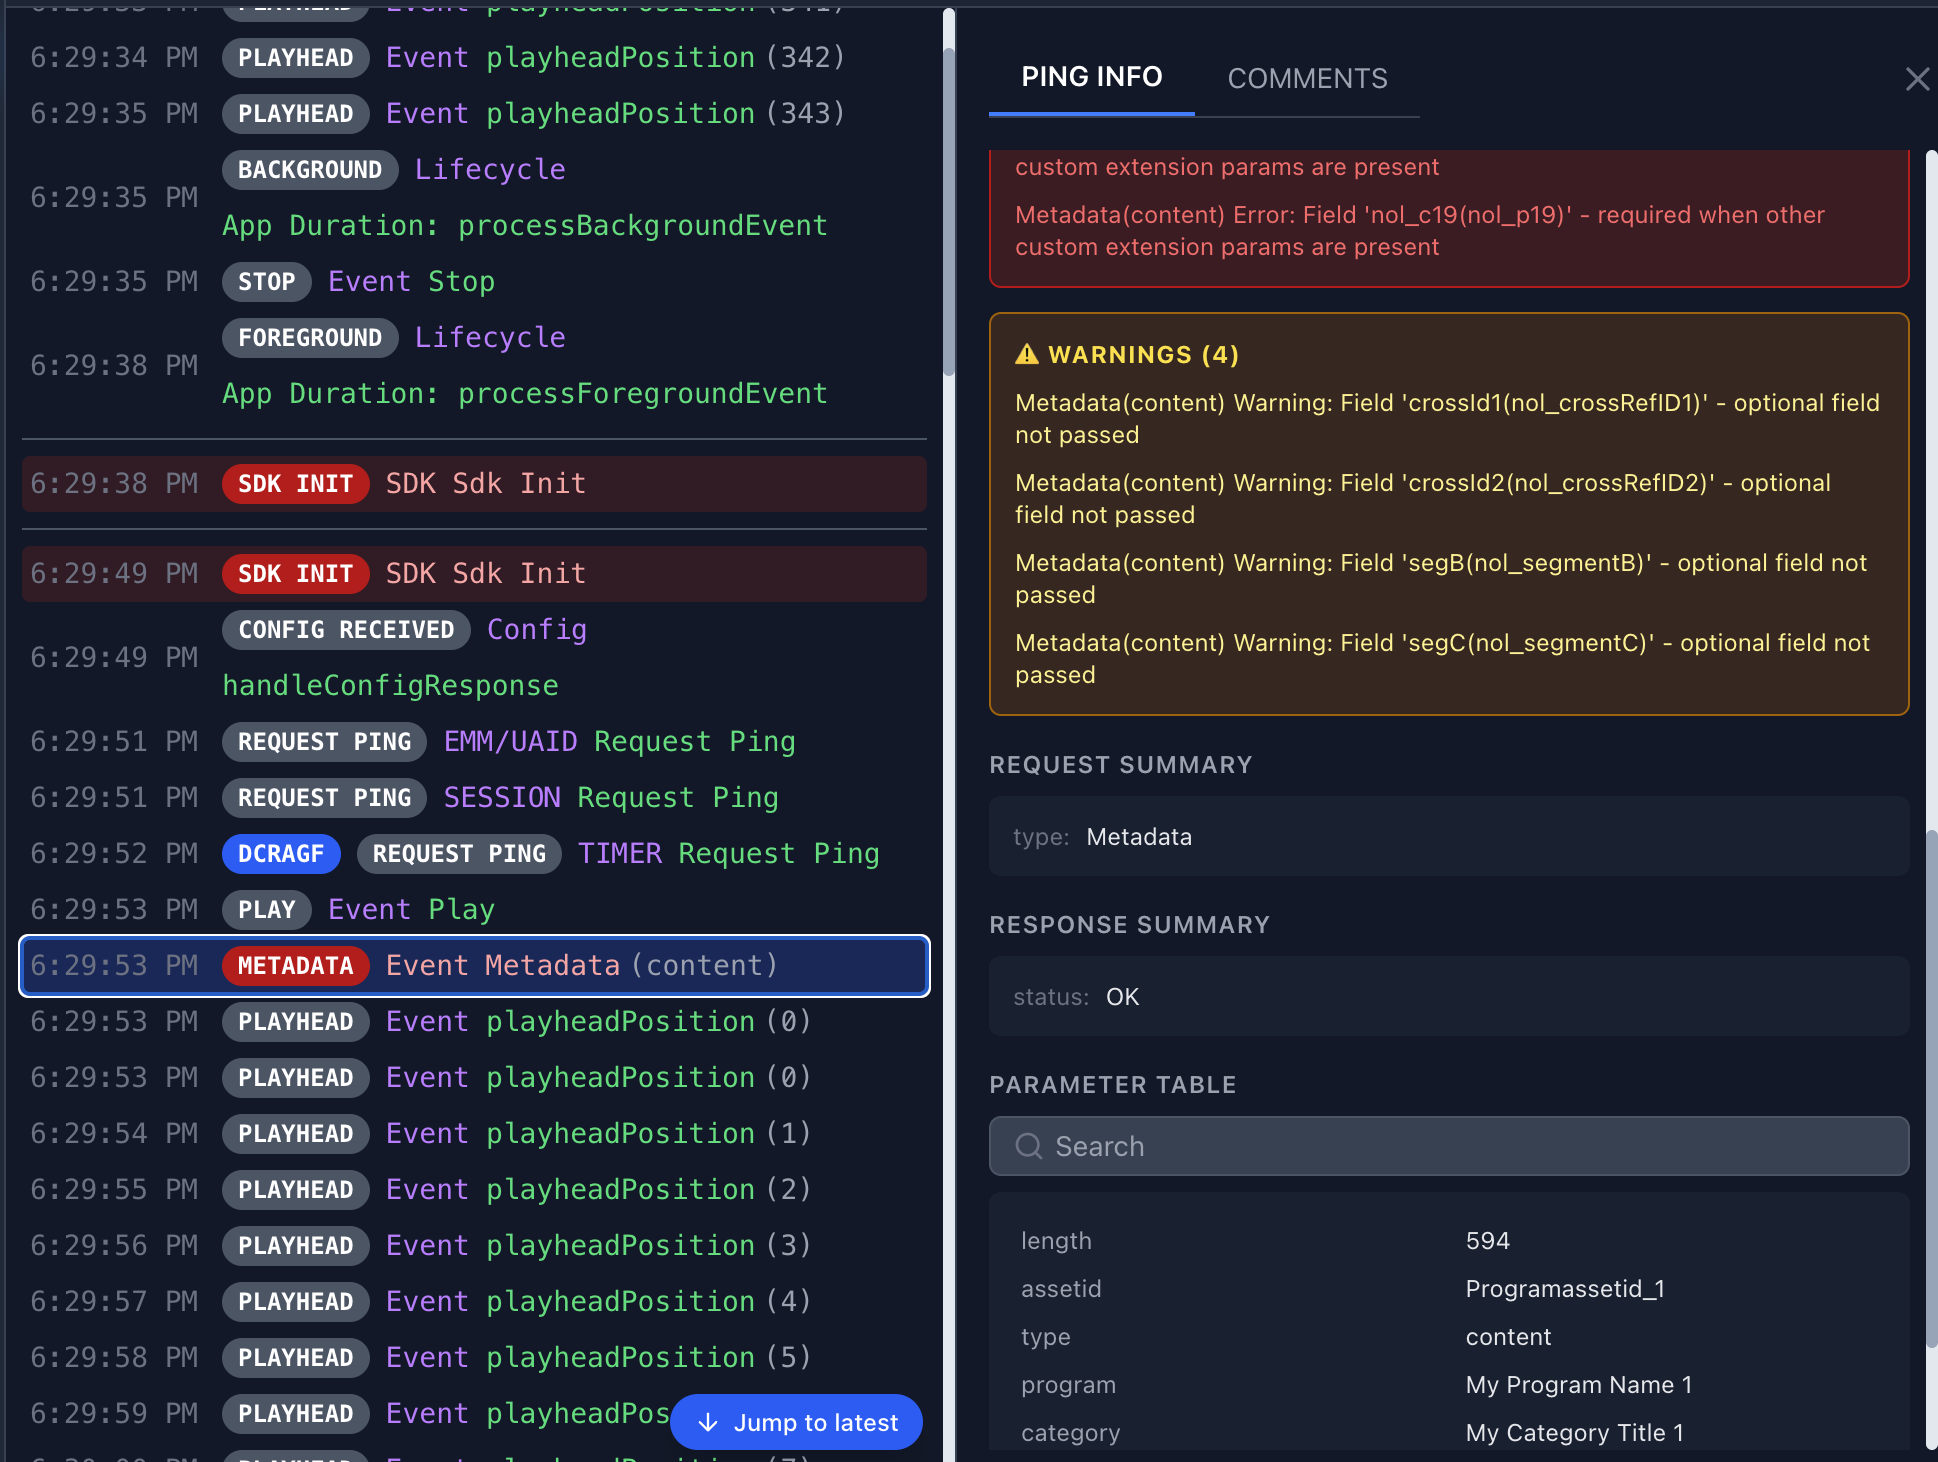
Red rows indicate validation failures — click to expand the PING INFO panel and see exactly what went wrong. Yellow warnings highlight optional field issues. The Parameter Table shows the exact values sent.
How Failures Appear
When a validation issue is detected, you'll see it in two places simultaneously:
- Validation Checklist (left panel) — the rule turns ✗ red with a red left border
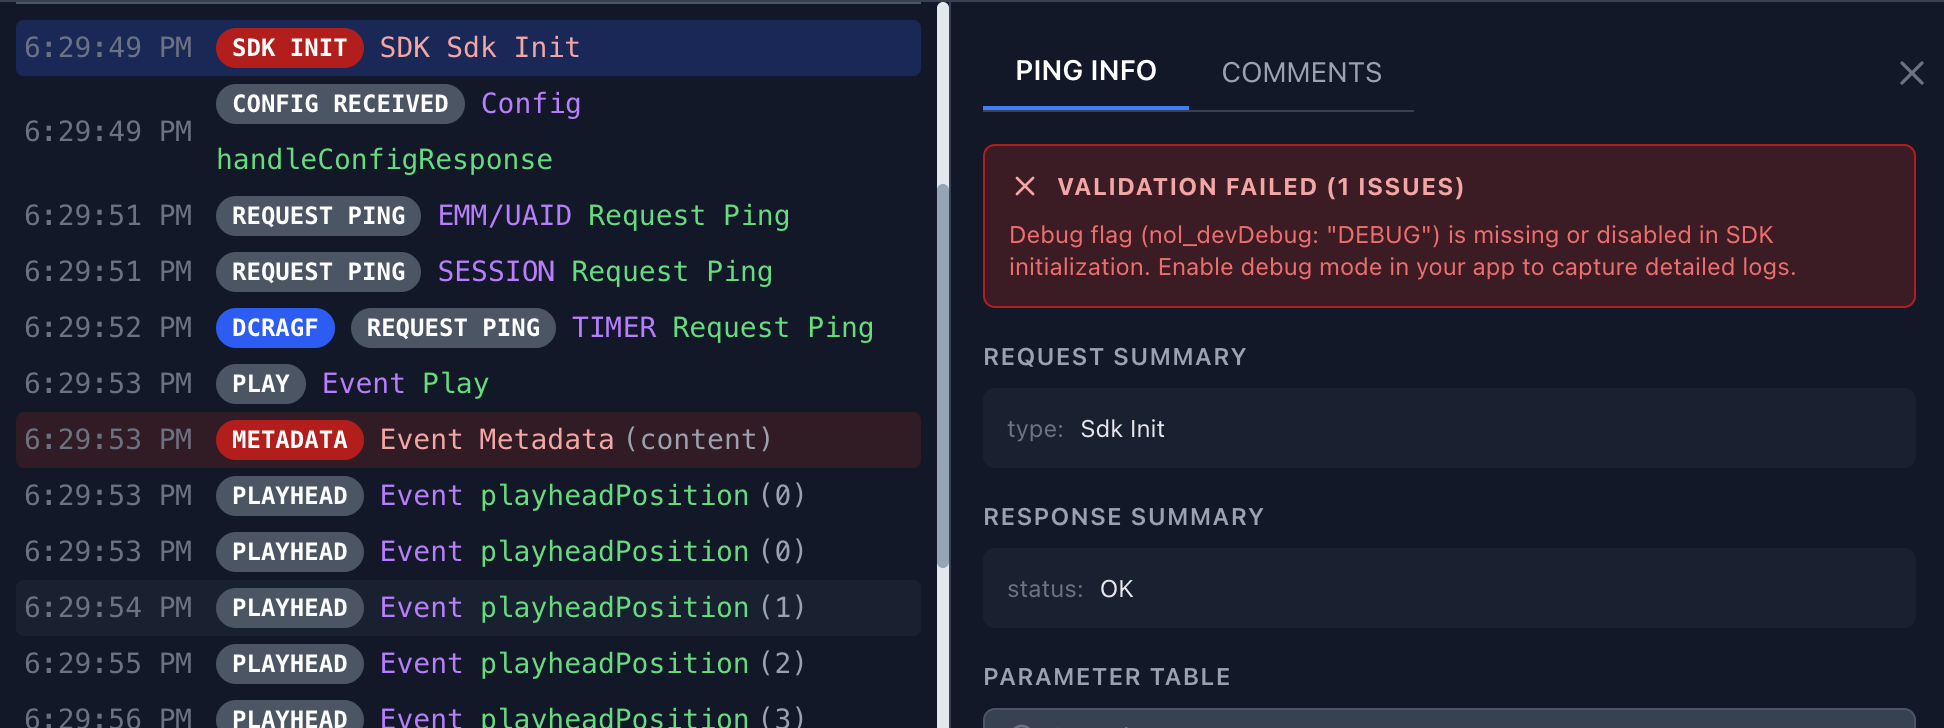
- Log Stream (center panel) — the offending log row gets a red background highlight. Click the row to see "VALIDATION FAILED (N ISSUES)" with a description of exactly what went wrong (e.g., "Debug flag (nol_devDebug: "DEBUG") is missing or disabled in SDK initialization")
"Validate" Button
For event sequence validation, you'll see a purple ▶ Validate button inside Test Case 2 ("Play a VOD stream till end of video without pausing") under DCR Video. Click it after you've completed the full playback flow for that test case — the tool then checks whether all the collected logs match the expected API event sequence (play → loadMetadata → setPlayheadPosition → stop → end, with ad break cycles if ads are present). The result expands to show each step in the sequence with pass/fail status.
8 Failure Types
When validation detects an issue, the tool categorizes it into one of these failure types. Each type appears differently in the log stream and checklist.
🔴 Metadata failure
▼A mandatory metadata field is missing, empty, or doesn't match the expected format. The METADATA log row is highlighted red. Expand the rule to see which specific field failed and what was expected (e.g., assetid must be a non-empty string, type must be "content" or "ad"). Fix the field value in your SDK's loadMetadata call and re-run.
🔴 CMS Mismatch failure
▼The metadata values sent by the SDK don't match the expected CMS mapping provided by Nielsen. This typically means the assetid, program, title, or other fields in your loadMetadata call don't correspond to what Nielsen has on record for your App ID. Check with your Nielsen TAM to confirm the correct CMS mapping values for your content.
🔴 Sequence failure
▼SDK API events arrived in the wrong order or a required step was missing. After completing playback, click the Validate button — the tool compares your captured logs against the expected event sequence and shows each step with pass/fail status so you can pinpoint exactly where it broke.
The basic content-only sequence is: play → loadMetadata → setPlayheadPosition → stop → end. If your content includes ads, the sequence is longer — each ad break (preroll, midroll, postroll) inserts its own loadMetadata → setPlayheadPosition → stop cycle, with content metadata resent when returning to main content. The Integration Wizard (Step 5) shows the exact sequence for your specific configuration.
Sequence failures are latching — once red, they stay red for the session. Use Reset, then relaunch and retry.
🔴 Playhead failure
▼Playhead values didn't meet criteria — negative values detected. The tool validates that all setPlayheadPosition values are non-negative integers. Check your playhead implementation to ensure you're not passing negative numbers.
🔴 Debug flag failure
▼The SDK initialized without the debug flag enabled. The "Debug Flag Enabled" rule turns red. For mobile apps, set nol_devDebug = DEBUG in your SDK initialization options (see the Debug Flag Setup in Section 6). For browser devices, this is handled automatically by the tool.
🟡 Warning (yellow)
▼An optional metadata field is missing or blank. Warnings appear as yellow-highlighted rows in the log stream and are shown separately from red validation errors. They don't block certification but should be reviewed — filling in optional fields like crossRefID1 improves measurement quality.
9 Session Export & Import
Export
Downloads a .json file containing all validation results, captured logs, and session metadata. The file includes a SHA-256 integrity hash to detect modifications.
Import
Load a previously exported .json session file. Click the Import button or drag-and-drop the file directly onto the "or drop file here" area. The tool verifies the integrity hash before restoring the session. Once imported, the session is fully interactive — you can click logs to inspect them, expand rules, use filters, and review all validation results exactly as they were at export time.
What to Send to Your Nielsen Contact
When submitting for certification review:
✔ The exported .json session file — the primary deliverable containing everything Nielsen needs.
✔ Platform and device — e.g., "iPhone 15, iOS 18.3, USB" or "Chrome via Playwright, macOS".
10 Product Types
Select the product type matching your integration. Each loads different test cases and validation rules.
🎥 DCR Video Most Comprehensive
▼For apps that play video content (live streams, VOD, clips). Includes ads certification (preroll, midroll, postroll).
Test cases (exact labels):
| # | Test Case | What It Validates | Notes |
|---|---|---|---|
| 1 | Verify SDK initialization and configuration 🔓 | SDK Core Loaded, Config Response Received, Debug Flag Enabled (mobile only — browser is automatic) | Must run first. Unlocks all other test cases once completed. |
| 2 | Play a VOD stream till end of video without pausing | Content & Ad Metadata (preroll, midroll, postroll), Playhead values, full API/Event Sequence (play → loadMetadata → playhead → stop → end) | Ad metadata rules are optional — only validated if ads are detected. |
| 3 | Forward the video playback for VOD by more than 30 seconds | Seek/scrub forward detection (>30s jump in playhead) | |
| 4 | Rewind the video playback for VOD | Seek/scrub backward detection (playhead decreases) | |
| 5 | Pause and Resume Validation (>5s) | Gap detection in playhead positions (>5 second pause between consecutive playheads) | |
| 6 | Move the app to Background and then relaunch (>5s) | App lifecycle handling — detects >5 second gap when app goes to background and returns | Mobile/TV only (not shown for browser devices) |
Available in: Global + AGF + Médiamétrie markets. Fire TV VegaOS also includes additional blur/focus and app-close tests.
📄 DCR Static
▼For non-video content — articles, news pages, text content.
Test cases (exact labels):
| # | Test Case | What It Validates | Notes |
|---|---|---|---|
| 1 | Verify SDK initialization and configuration 🔓 | SDK Core Loaded, Config Response Received, Debug Flag Enabled (mobile only) | Must run first. Unlocks all other test cases. |
| 2 | View static page and scroll till end of page or switch to another page | Static Metadata Fields, Page Navigation (separate rule sets for browser vs. mobile platforms) | |
| 3 | Move app to background for 20 secs and relaunch | App lifecycle handling — background the app for 20+ seconds, then bring it back to foreground | Mobile/TV only (not shown for browser devices) |
Available in: Global + AGF + Médiamétrie markets. Fire TV VegaOS also includes blur/focus and app-close tests.
📡 DTVR
▼For Digital TV Ratings — linear/live TV with ID3 tags.
Test cases (exact labels):
| # | Test Case | What It Validates | Notes |
|---|---|---|---|
| 1 | Verify SDK initialization and configuration 🔓 | SDK Core Loaded, Config Response Received, Debug Flag Enabled (mobile only) | Must run first. Unlocks all other test cases. |
| 2 | Play DTVR stream for 2 mins | DTVR Metadata (admodel field), ID3 Tag validation (249 chars, starts with www.nielsen.com) | |
| 3 | DTVR Pause/Resume content for 30 seconds | Offset validation — pause for 30+ seconds, then resume; checks pcOffset and fdOffset ranges | |
| 4 | DTVR Scrub back for 30 seconds | Offset backward detection — scrub back 30+ seconds in DTVR stream | |
| 5 | DTVR Scrub forward for 2 mins | Offset forward detection — scrub forward 120+ seconds in DTVR stream |
Available in: Global market only (not in AGF or Médiamétrie). Fire TV VegaOS also includes blur/focus and app-close tests.
11 Supported Platforms
The Diagnostic Tool captures logs from the following devices and environments:
📱 iPhone / iPad (USB)
Physical device via USB cable
📱 iOS Simulator
Xcode iOS Simulator (booted)
🤖 Android Device (USB)
Physical device via USB cable
🤖 Android Emulator
Android Studio emulator (booted)
📺 Fire TV (Wi-Fi)
Amazon Fire TV via IP connection
📺 Fire TV VegaOS (USB)
Fire TV VegaOS variant via USB only
🌐 Browser
Chrome, Firefox, Safari via Playwright
📺 Apple TV (Wi-Fi)
Apple TV via Wi-Fi pairing & tunnel
Apple TV Connection Flow
Apple TV requires a multi-step pairing process:
Open Remote Settings on Apple TV
Go to Settings → Remotes and Devices → Remote App and Devices. Keep this screen open.
Select your device
In the tool's Configuration, discovered Apple TV devices appear in the device list. Select yours.
Start Pairing
Click the Connect button. A 6-digit PIN appears on your Apple TV screen.
Enter PIN
Type the 6-digit PIN into the tool's dialog. Pairing is persistent across sessions — no re-pairing needed next time.
Start Tunnel
The tool starts a log tunnel. You may be asked for your Mac's admin (sudo) password.
Verify & Capture
The tool verifies syslog connectivity. Once confirmed, you're ready to start validation.
12 Tips & Best Practices
🎯 Workflow
▶ Always Play before launching the app (mobile)
The #1 cause of gray rules. The tool must be listening when the SDK initializes. For browser devices, clicking Play opens the URL automatically.
🔄 Don't uninstall between retries
Just close the app and relaunch. No need to uninstall and reinstall.
⏯ One test case at a time
Complete each test case fully before moving to the next. Out-of-order actions cause sequence failures.
💾 Export frequently
Export after completing each product type. Preserves results even if you Reset later.
🔌 Connectivity
📱 USB devices
Keep device unlocked during validation. On iOS, tap "Trust" when prompted. Screen lock interrupts the log stream.
📶 Wi-Fi devices (Fire TV, Apple TV)
Both devices must be on the same network and subnet. Corporate Wi-Fi blocking discovery? Use your phone's mobile hotspot as a workaround.
🌐 Browser validation
Enter the complete URL including https://. The tool launches its own browser via Playwright — it doesn't use your installed Chrome. First run downloads browser binaries (~500 MB).
13 Quick Reference Links
These resources on GitHub always reflect the latest version:
For assistance, contact the Nielsen Ops/Certification team or your Nielsen Technical Account Manager (TAM).
© 2026 The Nielsen Company (US), LLC. All Rights Reserved. Confidential and Proprietary.